Clinlytix360 – End-to-End Clinical Analytics Pipeline
Tech Stack: Python, R (psych, lavaan), Apache Airflow, Streamlit, Docker, PostgreSQL
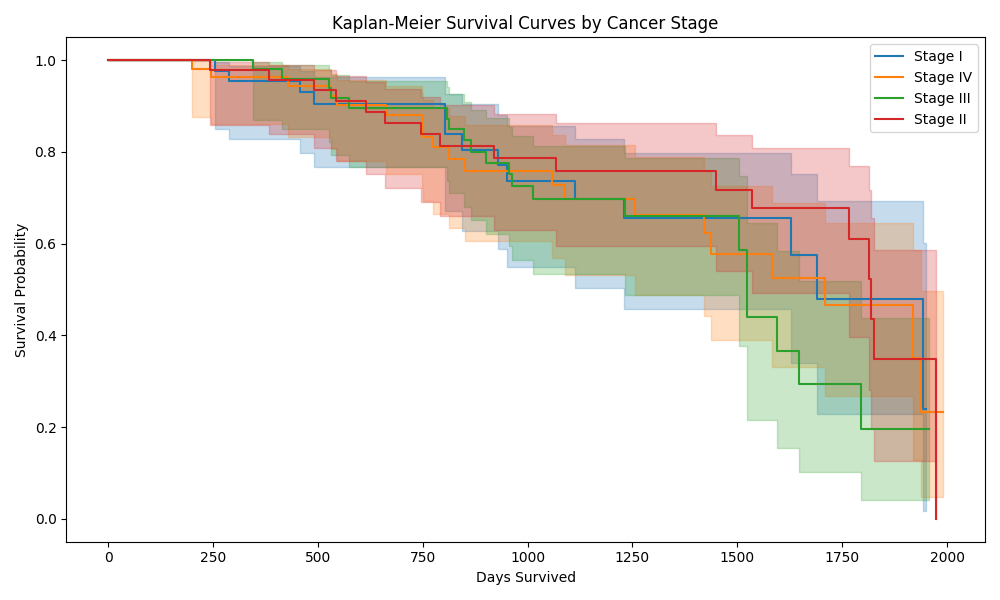
Developed a comprehensive clinical analytics platform simulating real-world workflows – from raw EHR and PRO/COA data ingestion to survival analysis, psychometric evaluation, and interactive dashboards.
- Automated ETL orchestration with Apache Airflow and Docker
- PRO/COA psychometric analysis using R's psych and lavaan packages
- Cronbach’s Alpha and Exploratory/Confirmatory Factor Analysis for scale validation
- Kaplan-Meier survival curves and Cox regression models
- Streamlit dashboards to visualize clinical outcomes and psychometric results
- PostgreSQL database and Parquet storage for cleaned datasets
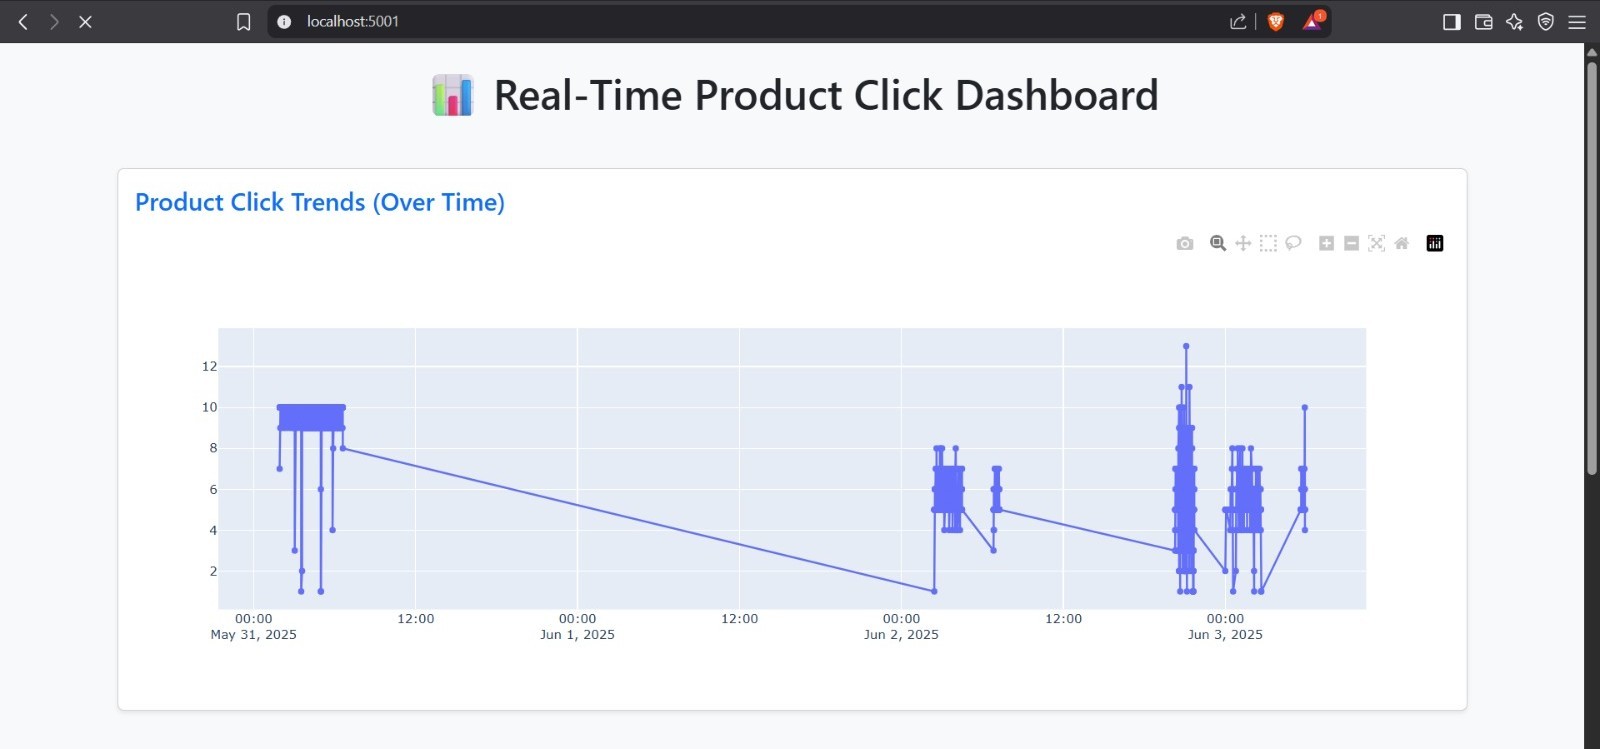
Real-Time Product Clickstream Analytics
Tech Stack: Kafka, Spark Structured Streaming, Airflow, Flask, Plotly, Parquet, Tableau
Built a real-time data pipeline simulating e-commerce product clicks using Kafka, Spark, and Airflow. Live dashboards powered by Flask + Plotly and advanced analytics enabled via Tableau.
- Apache Kafka for real-time event ingestion
- Apache Spark for windowed aggregation and processing
- Apache Airflow to schedule and automate tasks
- Flask + Plotly dashboard for visualizing product clicks
- Data stored in Parquet and CSV formats
- Tableau for interactive analytics and trend reporting
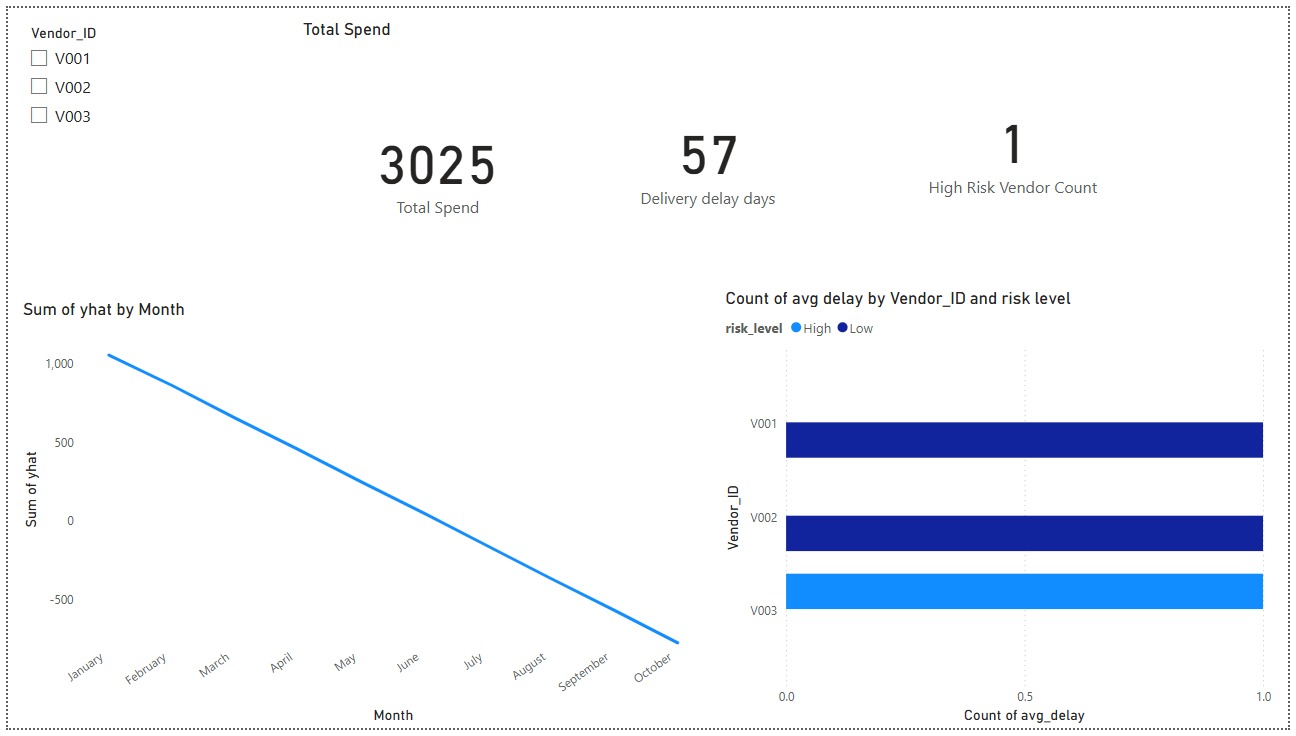
ProcureCast 360: SAP Procurement Local Pipeline
Tech Stack: Python, SQL, Apache Airflow, Prophet, Scikit-Learn, Power BI, Parquet
Developed an end-to-end procurement analytics pipeline simulating SAP ERP data ingestion, processing, forecasting, and risk assessment. The solution automates ETL workflows and delivers actionable insights to support procurement decision-making.
- Ingested SAP-style procurement tables (Purchase Orders, Invoices, Vendor Master Data)
- Automated data pipelines orchestrated via Apache Airflow
- Spend forecasting using Facebook Prophet time series models
- Supplier risk scoring with Isolation Forest anomaly detection
- Data stored in Parquet format and relational databases
- Interactive Power BI dashboards for procurement spend and supplier risk insights
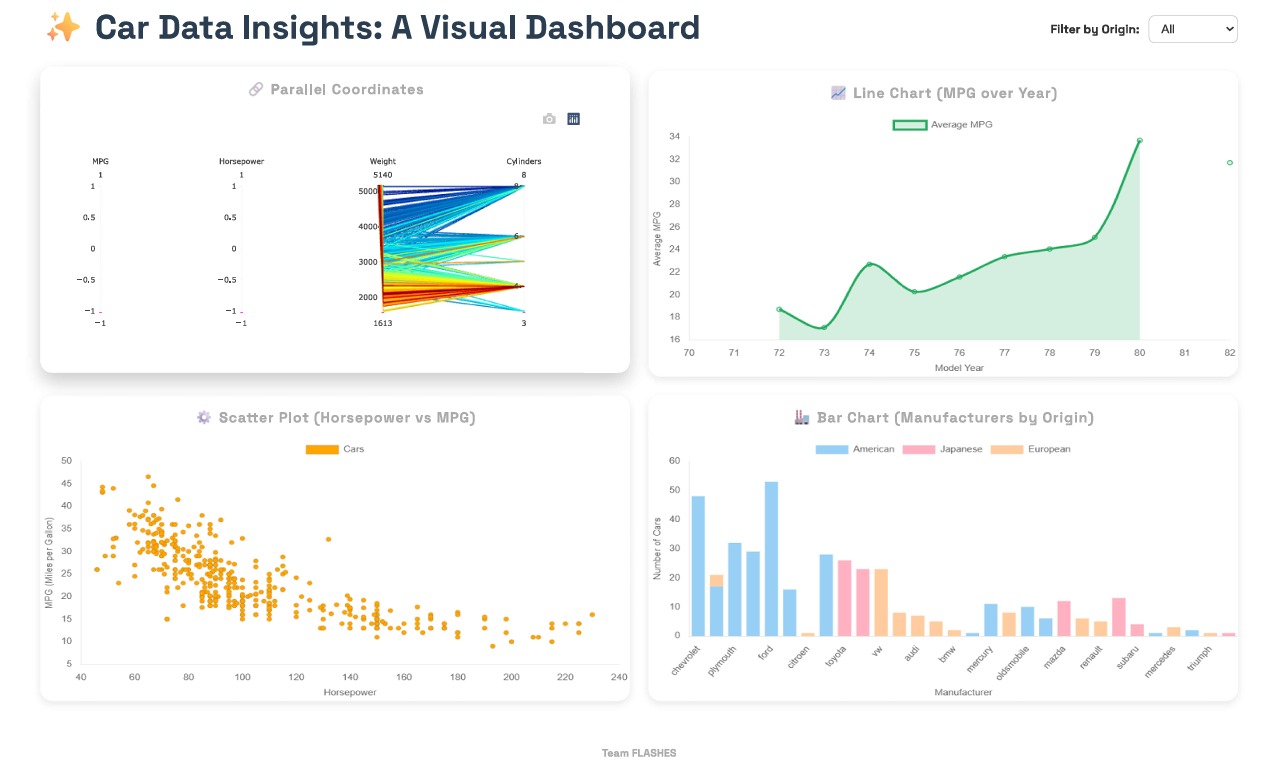
Interactive Car Data Dashboard
Developed an interactive dashboard using D3.js to visualize car performance data with coordinated charts and brushing features.
- Interactive scatter plots with regression analysis
- Brushing, zooming, and multi-view coordination
- Published on GitHub Pages
Tools: D3.js, JavaScript, HTML/CSS
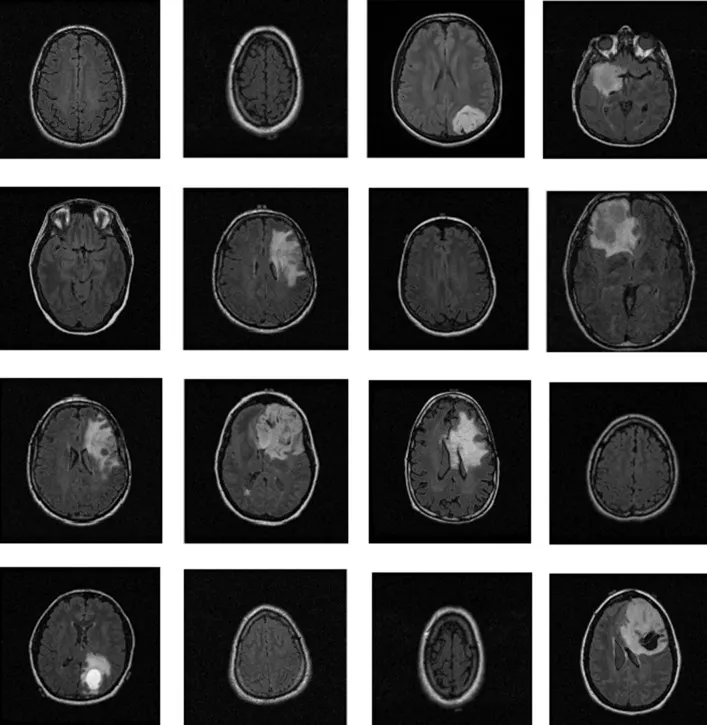
Brain Tumor Diagnosis Using Deep Learning
Built a CNN-based pipeline to classify and localize brain tumors in MRI scans. Achieved 99.65% accuracy with VGG19.
- Trained CNN, U-Net, and ResNet50 architectures
- Performed pixel-wise segmentation
- Validated with medical imaging metrics
Tools: Python, TensorFlow, Keras
Fake News Detection Using Machine Learning
Built a Natural Language Processing pipeline to detect fake news from online articles using supervised learning techniques. The project combines text cleaning, feature extraction, and classification models to separate real and fake news effectively.
- Preprocessed news articles with NLTK and regex
- Extracted features using TF-IDF and CountVectorizer
- Trained Logistic Regression, Random Forest, and SVM
- Achieved over 92% accuracy with F1-score analysis
- Evaluated using confusion matrix and precision-recall
Tools: Python, Scikit-learn, Pandas, NLTK, Matplotlib
Car Seat Sales Prediction Using Regression Models
Built a regression model to forecast sales for car seat products across different retail stores. The project involved exploratory analysis, feature selection, and predictive modeling using both linear and ensemble techniques.
- Performed EDA and correlation analysis on sales data
- Trained Linear, LASSO, and Random Forest models
- Selected best model using RMSE from cross-validation
- Identified key drivers like shelf location and advertising
- Visualized model output and variable importance
Tools: R, glmnet, caret, ggplot2, dplyr